Why add to (UK) equities?
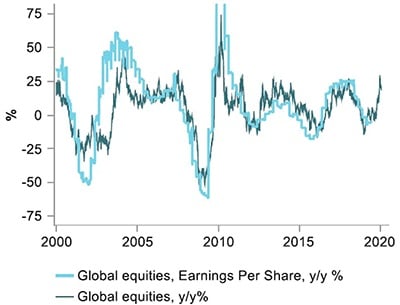
What a difference a year makes. After a bruising 2018, last year allowed investors to capture the second-best return on a blend of global equities and long-dated bonds in 30 years. For stocks it was also a year of record multiple expansion, trounced on only one occasion since the late 1980s – in 2009, when markets were recovering from the crushing financial crisis. Ergo: in 2020, earnings will need to “grow in” to prices for the rally to have “legs” (Figure 1).

Sources: Bloomberg, Macrobond and Columbia Threadneedle Investments, 27 January 2020.
There are at least two reasons to think that they may. First, threats around global trade and a harder Brexit are considerably lower than they were, even in mid-December1. Less uncertainty should allow business confidence and corporate earnings to recover somewhat in 2020, particularly in areas that were most sensitive to developments in each.
Second, on both consensus as well as our own forecasts, economic growth is poised to be almost “Goldilocks-like” – not so strong that interest rates will need to rise, nor so weak to rekindle fears of recession. Policymakers are thus postured to be “low for longer”, so the discount rate applied to anticipated earnings is likely to remain helpfully low, with credit spreads contained. The latter makes for uncomfortable broad-based equity investing, if bond markets are in the wrong place. But there are some exceptions – and the UK increasingly appears as one of them.

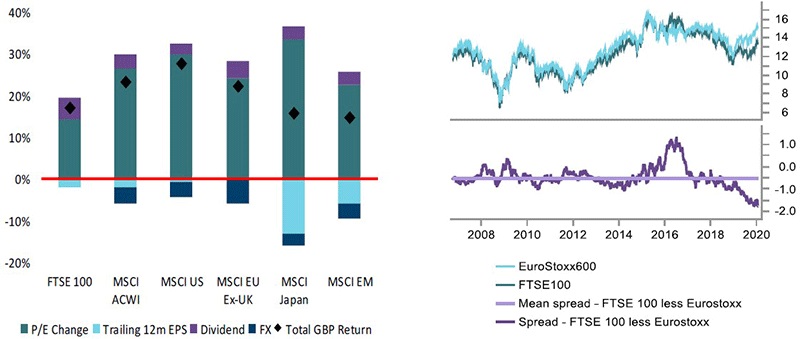
Sources: Bloomberg, Macrobond and Columbia Threadneedle Investments, 27 January 2020.
Uk equities back in favour
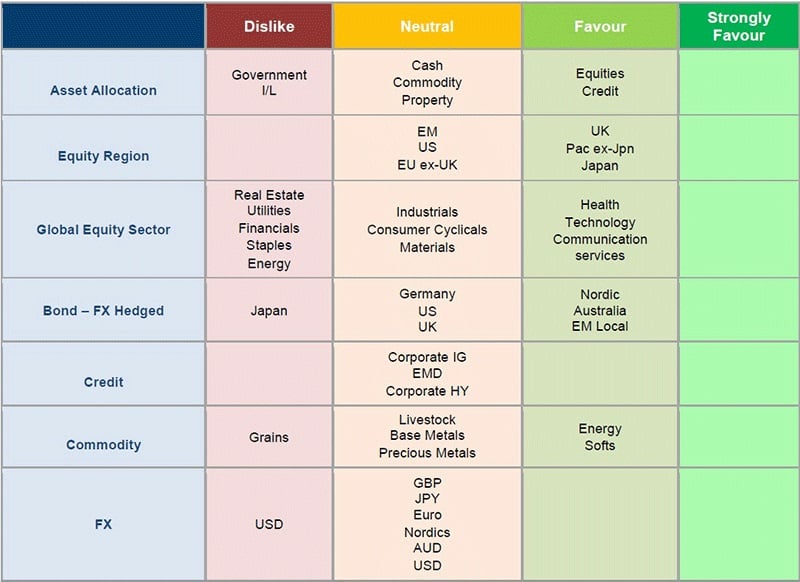
In early January we raised our allocation to UK stocks to favour, from neutral previously, thereby lifting equities overall to a preferred asset class. Although UK stocks participated in last year’s broader rerating (Figure 2), the move relative to other markets was sufficiently subdued that the gap between one-year forward P/Es widened to nearly two turns versus Europe and three-and-ahalf turns versus global equities – more than double historical averages and 15-year extremes (Figure 3). Investor underweights also appear extreme, notwithstanding the modest rise in ETF flows post the election.

Source: Columbia Threadneedle Investments, 27 January 2020.


